Helsinki大学ではアマゾン川のGISデータを使用していますが、わたしは国土数値情報の河川データ(https://nlftp.mlit.go.jp/ksj/gml/datalist/KsjTmplt-W05.html)から愛媛県内の河川のデータを使用しました。
愛媛県内の河川データのShapeファイルはあらかじめGoogleDriveにアップデートしておく必要があります。
まずはいつもどおり必要になりそうなライブラリーをインポートします。
#ライブラリーのインポート
!pip install geopandas
import geopandas as gpd
import matplotlib.pyplot as plt
#matplotlibで日本語を表示するためのおまじない
!pip install japanize-matplotlib
import japanize_matplotlib
#Google ColabでGoogle Driveを使用するときのおまじない
from google.colab import drive
drive.mount('/content/drive')
次に、GoogleDriveにアップロードした国土数値情報の河川データからShapeFileを読み込みます。よく見ると、rivernode.shpとstream.shpという2種類のShapeFileがあるので、両方読み込んでみました。
#国土数値情報からダウンロードした愛媛県の河川データ(shape形式)をGeoPandasで読み込み
gdf_rivernode = gpd.read_file('/content/drive/MyDrive/Colab Notebooks/W05-06_38_GML(EhimePrefRiverData)/W05-06_38-g_RiverNode.shp')
gdf_stream = gpd.read_file('/content/drive/MyDrive/Colab Notebooks/W05-06_38_GML(EhimePrefRiverData)/W05-06_38-g_Stream.shp')
gdf_stream.head()
こちらがstream.shpの中身です。
| W05_001 | W05_002 | W05_003 | W05_004 | W05_005 | W05_006 | W05_007 | W05_008 | W05_009 | W05_010 | geometry |
|---|
| 0 | 880801 | 8808010070 | 2 | 丁字ヶ谷川 | 2 | 1 | #t-3803970 | #t-3803891 | #t-3803965 | #t-3803942 | LINESTRING (132.94984 33.78444, 132.94976 33.7... |
|---|
| 1 | 880801 | 8808010000 | 0 | 名称不明 | 2 | 1 | #t-3803785 | #t-3803743 | #t-3803785 | #t-3803743 | LINESTRING (132.92497 33.77647, 132.92435 33.7... |
|---|
| 2 | 380015 | 3800150000 | 0 | 名称不明 | 3 | 1 | #t-3800860 | #t-3800841 | #t-3800860 | #t-3800841 | LINESTRING (132.55229 33.15954, 132.55229 33.1... |
|---|
| 3 | 880802 | 8808020360 | 2 | 明門川 | 2 | 1 | #t-3801328 | #t-3801437 | #t-3801428 | #t-3801437 | LINESTRING (132.61820 33.41257, 132.61855 33.4... |
|---|
| 4 | 380034 | 3800340000 | 0 | 名称不明 | 3 | 1 | #t-3800075 | #t-3800078 | #t-3800075 | #t-3800078 | LINESTRING (132.41293 33.41582, 132.41294 33.4... |
|---|
こちらがrivernode.shp側の中身です。
| W05_001 | W05_011 | W05_000 | geometry |
|---|
| 0 | 880807 | 167 | t-3600006 | POINT (133.68578 33.96491) |
|---|
| 1 | 380000 | 0 | t-3800001 | POINT (132.09359 33.40049) |
|---|
| 2 | 380000 | 145 | t-3800002 | POINT (132.09504 33.39538) |
|---|
| 3 | 380000 | 4 | t-3800003 | POINT (132.10685 33.37290) |
|---|
| 4 | 380000 | 4 | t-3800004 | POINT (132.10703 33.37104) |
|---|
それぞれの情報を図化してみると、以下のようになりました。河川だけを抽出して図化するだけで何となく愛媛県の輪郭が浮かび上がっています。
gdf_stream.plot(linewidth=0.5)
gdf_rivernode.plot(markersize=0.5)
GeoDataframeのgeometryの成り立ちから、stream.shpはLinestringで構成されており、rivernode.shpはPointで構成されています。国土数値情報 河川データの解説を読むと、河川の流路はその名のとおりstream.shp側のようです。
この中から愛媛県内の代表的な河川である重信川の流路データを取り出します。重信川の推計コード880801を利用して、重信川だけを取り出したGeoDataFrameを作成します。
#重信川(水系コード=88081)のデータのみをプロット
#水系コード列W05_001の中から水系コード880801の行のみを抽出し、
#gdf_shigenobuを生成。
gdf_shigenobu = gdf_stream[gdf_stream['W05_001'] == '880801']
#gdf_shigenobuをplot
gdf_shigenobu.plot()
重信川はこんな形をしているんですね。ちなみにデータの中身は以下の通りです。
gdf_shigenobu.head()
| W05_001 | W05_002 | W05_003 | W05_004 | W05_005 | W05_006 | W05_007 | W05_008 | W05_009 | W05_010 | geometry |
|---|
| 0 | 880801 | 8808010070 | 2 | 丁字ヶ谷川 | 2 | 1 | #t-3803970 | #t-3803891 | #t-3803965 | #t-3803942 | LINESTRING (132.94984 33.78444, 132.94976 33.7... |
|---|
| 1 | 880801 | 8808010000 | 0 | 名称不明 | 2 | 1 | #t-3803785 | #t-3803743 | #t-3803785 | #t-3803743 | LINESTRING (132.92497 33.77647, 132.92435 33.7... |
|---|
| 5 | 880801 | 8808010000 | 0 | 名称不明 | 3 | 1 | #t-3803531 | #t-3803485 | #t-3803531 | #t-3803485 | LINESTRING (132.88076 33.89427, 132.88071 33.8... |
|---|
| 6 | 880801 | 8808010000 | 0 | 名称不明 | 3 | 1 | #t-3803468 | #t-3803448 | #t-3803468 | #t-3803448 | LINESTRING (132.87166 33.87553, 132.87164 33.8... |
|---|
| 7 | 880801 | 8808010000 | 0 | 名称不明 | 3 | 1 | #t-3803236 | #t-3803223 | #t-3803236 | #t-3803223 | LINESTRING (132.82464 33.69849, 132.82462 33.6... |
|---|
ほかの方法で確認すると456行ものデータで構成されているようです。本流・支流とたくさん分岐があるので、それらを1つづつLinestringにすると、すごい数の本数になるということだと認識しました。
この重信川のデータを単純化してみます。Simplify()というメソッドを使うようです。また、()内にはtoleranceというパラメータを使用して、単純化の程度を指定するようです。Helsinki大学の教材ではtolerance=20000で設定されていましたので、まずはその数値で単純化してみます。
#重信川の河川形状を単純化
#単純化したgeometryを生成
#まずは許容値tolerance=20000で設定
gdf_shigenobu['simplegeom'] = gdf_shigenobu.simplify(tolerance=20000)
gdf_shigenobu = gdf_shigenobu.set_geometry('simplegeom')
gdf_shigenobu.plot()
かなり単純化されています。toleranceによってどの程度単純化されるのかよくわからないので、toleranceをいくつか変化させた結果を並べて表示してみます。
#国土数値情報からダウンロードした愛媛県の河川データ(shape形式)をGeoPandasで読み込み
gdf_stream = gpd.read_file('/content/drive/MyDrive/Colab Notebooks/W05-06_38_GML(EhimePrefRiverData)/W05-06_38-g_Stream.shp')
###tolerancなし
#重信川(水系コード=88081)のデータのみをプロット
#水系コード列W05_001の中から水系コード880801の行のみを抽出し、
#gdf_shigenobuを生成。
gdf_shigenobu = gdf_stream[gdf_stream['W05_001'] == '880801']
###tolerance=20000で計算
#重信川(水系コード=88081)のデータのみをプロット
#水系コード列W05_001の中から水系コード880801の行のみを抽出し、
#gdf_shigenobuを生成。
gdf_shigenobu_tol20000 = gdf_stream[gdf_stream['W05_001'] == '880801']
#許容値tolerance=2000に変更
gdf_shigenobu_tol20000['simplegeom'] = gdf_shigenobu_tol20000.simplify(tolerance=20_000)
gdf_shigenobu_tol20000 = gdf_shigenobu_tol20000.set_geometry('simplegeom')
###tolerance=2000で計算
#重信川(水系コード=88081)のデータのみをプロット
#水系コード列W05_001の中から水系コード880801の行のみを抽出し、
#gdf_shigenobuを生成。
gdf_shigenobu_tol2000 = gdf_stream[gdf_stream['W05_001'] == '880801']
#許容値tolerance=2000に変更
gdf_shigenobu_tol2000['simplegeom'] = gdf_shigenobu_tol2000.simplify(tolerance=2000)
gdf_shigenobu_tol2000 = gdf_shigenobu_tol2000.set_geometry('simplegeom')
###tolerance=200で計算
#重信川(水系コード=88081)のデータのみをプロット
#水系コード列W05_001の中から水系コード880801の行のみを抽出し、
#gdf_shigenobuを生成。
gdf_shigenobu_tol200 = gdf_stream[gdf_stream['W05_001'] == '880801']
#許容値tolerance=2000に変更
gdf_shigenobu_tol200['simplegeom'] = gdf_shigenobu_tol200.simplify(tolerance=200)
gdf_shigenobu_tol200 = gdf_shigenobu_tol200.set_geometry('simplegeom')
#グラフで結果を表示
fig, axs = plt.subplots(nrows=2, ncols=2, figsize=(8, 8))
gdf_shigenobu.plot(ax=axs[0, 0])
axs[0, 0].set_title('No tolerance')
gdf_shigenobu_tol200.plot(ax=axs[0, 1], color="red")
gdf_shigenobu.plot(ax=axs[0, 1], linewidth=1, linestyle=':')
axs[0, 1].set_title('tolerance=200')
gdf_shigenobu_tol2000.plot(ax=axs[1, 0], color="red")
gdf_shigenobu.plot(ax=axs[1, 0], linewidth=1, linestyle=':')
axs[1, 0].set_title('tolerance=2000')
gdf_shigenobu_tol20000.plot(ax=axs[1, 1], color="red")
gdf_shigenobu.plot(ax=axs[1, 1], linewidth=1, linestyle=':')
axs[1,1].set_title('tolerance=20000')
#グラフの間隔を調整する
plt.tight_layout()
#グラフを表示
plt.show()
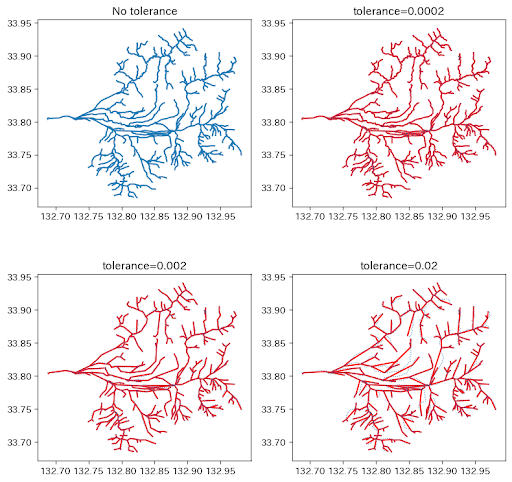
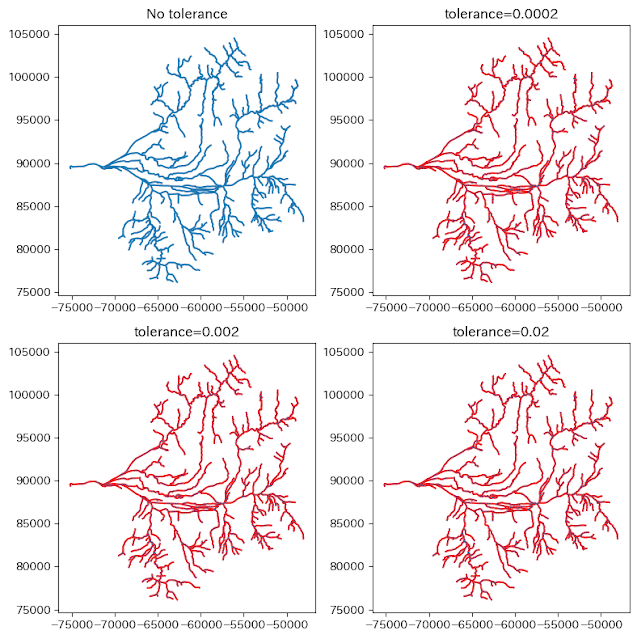
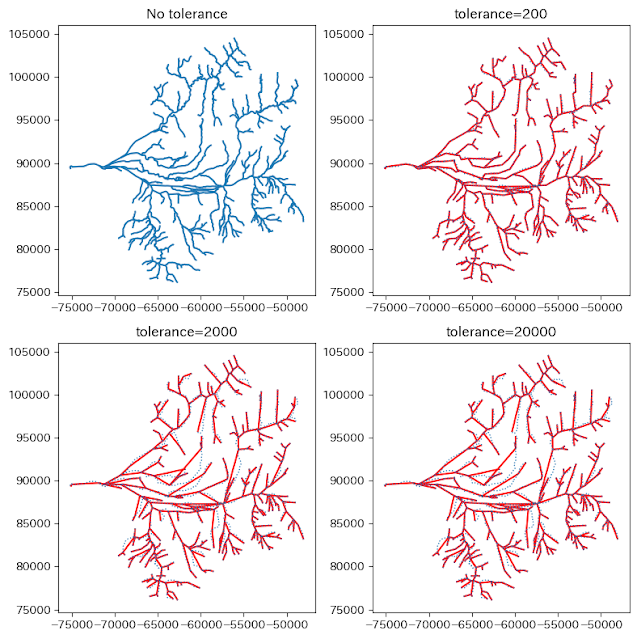
出力は以下の通りです。赤線は単純化後のデータ、青色がオリジナルデータです。
toleranceを200,2000,20000にそれぞれ設定しましたが、大きな変化はなく、どれも大胆に単純化・デフォルメされているように見えます。
toleranceを小さな数値にしてみます。
#国土数値情報からダウンロードした愛媛県の河川データ(shape形式)をGeoPandasで読み込み
gdf_stream = gpd.read_file('/content/drive/MyDrive/Colab Notebooks/W05-06_38_GML(EhimePrefRiverData)/W05-06_38-g_Stream.shp')
###tolerancなし
#重信川(水系コード=88081)のデータのみをプロット
#水系コード列W05_001の中から水系コード880801の行のみを抽出し、
#gdf_shigenobuを生成。
gdf_shigenobu = gdf_stream[gdf_stream['W05_001'] == '880801']
###tolerance=2で計算
#重信川(水系コード=88081)のデータのみをプロット
#水系コード列W05_001の中から水系コード880801の行のみを抽出し、
#gdf_shigenobuを生成。
gdf_shigenobu_tol002 = gdf_stream[gdf_stream['W05_001'] == '880801']
#許容値tolerance=2000に変更
gdf_shigenobu_tol002['simplegeom'] = gdf_shigenobu_tol002.simplify(tolerance=0.02)
gdf_shigenobu_tol002 = gdf_shigenobu_tol002.set_geometry('simplegeom')
###tolerance=2000で計算
#重信川(水系コード=88081)のデータのみをプロット
#水系コード列W05_001の中から水系コード880801の行のみを抽出し、
#gdf_shigenobuを生成。
gdf_shigenobu_tol0002 = gdf_stream[gdf_stream['W05_001'] == '880801']
#許容値tolerance=2000に変更
gdf_shigenobu_tol0002['simplegeom'] = gdf_shigenobu_tol0002.simplify(tolerance=0.002)
gdf_shigenobu_tol0002 = gdf_shigenobu_tol0002.set_geometry('simplegeom')
###tolerance=200で計算
#重信川(水系コード=88081)のデータのみをプロット
#水系コード列W05_001の中から水系コード880801の行のみを抽出し、
#gdf_shigenobuを生成。
gdf_shigenobu_tol00002 = gdf_stream[gdf_stream['W05_001'] == '880801']
#許容値tolerance=2000に変更
gdf_shigenobu_tol00002['simplegeom'] = gdf_shigenobu_tol00002.simplify(tolerance=0.0002)
gdf_shigenobu_tol00002 = gdf_shigenobu_tol00002.set_geometry('simplegeom')
#グラフで結果を表示
fig, axs = plt.subplots(nrows=2, ncols=2, figsize=(8, 8))
gdf_shigenobu.plot(ax=axs[0, 0])
axs[0, 0].set_title('No tolerance')
gdf_shigenobu_tol00002.plot(ax=axs[0, 1], color="red")
gdf_shigenobu.plot(ax=axs[0, 1], linewidth=0.8, linestyle=':')
axs[0, 1].set_title('tolerance=0.0002')
gdf_shigenobu_tol0002.plot(ax=axs[1, 0], color="red")
gdf_shigenobu.plot(ax=axs[1, 0], linewidth=0.8, linestyle=':')
axs[1, 0].set_title('tolerance=0.002')
gdf_shigenobu_tol002.plot(ax=axs[1, 1], color="red")
gdf_shigenobu.plot(ax=axs[1, 1], linewidth=0.8, linestyle=':')
axs[1,1].set_title('tolerance=0.02')
#グラフの間隔を調整する
plt.tight_layout()
#グラフを表示
plt.show()

緯度経度表示だとtoleranceをこの程度のオーダーにすれば、単純化に濃淡がつくようです。
せっかくなので、座標系を緯度経度ではなく、国土地理院の直交座標系に変換して、データを単純化してみます。
#gdf_shigenobuの座標系を経度緯度(EPSG:6668)から国土地理院直交座標系(EPSG:6672)
#国土数値情報からダウンロードした愛媛県の河川データ(shape形式)をGeoPandasで読み込み
gdf_stream = gpd.read_file('/content/drive/MyDrive/Colab Notebooks/W05-06_38_GML(EhimePrefRiverData)/W05-06_38-g_Stream.shp')
#gdf_shigenobuは座標系が定義されていなさそうなので、EPSG6668として定義
gdf_stream.crs = "EPSG:6668"
#gdf_shigenobuの座標系をEPSG:6672に変換
gdf_stream = gdf_stream.to_crs("EPSG:6672")
#重信川(水系コード=88081)のデータのみをプロット
#水系コード列W05_001の中から水系コード880801の行のみを抽出し、
#gdf_shigenobuを生成。
gdf_shigenobu = gdf_stream[gdf_stream['W05_001'] == '880801']
###tolerance=2で計算
#重信川(水系コード=88081)のデータのみをプロット
#水系コード列W05_001の中から水系コード880801の行のみを抽出し、
#gdf_shigenobuを生成。
gdf_shigenobu_tol002 = gdf_stream[gdf_stream['W05_001'] == '880801']
#許容値tolerance=2000に変更
gdf_shigenobu_tol002['simplegeom'] = gdf_shigenobu_tol002.simplify(tolerance=0.02)
gdf_shigenobu_tol002 = gdf_shigenobu_tol002.set_geometry('simplegeom')
###tolerance=2000で計算
#重信川(水系コード=88081)のデータのみをプロット
#水系コード列W05_001の中から水系コード880801の行のみを抽出し、
#gdf_shigenobuを生成。
gdf_shigenobu_tol0002 = gdf_stream[gdf_stream['W05_001'] == '880801']
#許容値tolerance=2000に変更
gdf_shigenobu_tol0002['simplegeom'] = gdf_shigenobu_tol0002.simplify(tolerance=0.002)
gdf_shigenobu_tol0002 = gdf_shigenobu_tol0002.set_geometry('simplegeom')
###tolerance=200で計算
#重信川(水系コード=88081)のデータのみをプロット
#水系コード列W05_001の中から水系コード880801の行のみを抽出し、
#gdf_shigenobuを生成。
gdf_shigenobu_tol00002 = gdf_stream[gdf_stream['W05_001'] == '880801']
#許容値tolerance=2000に変更
gdf_shigenobu_tol00002['simplegeom'] = gdf_shigenobu_tol00002.simplify(tolerance=0.0002)
gdf_shigenobu_tol00002 = gdf_shigenobu_tol00002.set_geometry('simplegeom')
#グラフで結果を表示
fig, axs = plt.subplots(nrows=2, ncols=2, figsize=(8, 8))
gdf_shigenobu.plot(ax=axs[0, 0])
axs[0, 0].set_title('No tolerance')
gdf_shigenobu_tol00002.plot(ax=axs[0, 1], color="red")
gdf_shigenobu.plot(ax=axs[0, 1], linewidth=0.8, linestyle=':')
axs[0, 1].set_title('tolerance=0.0002')
gdf_shigenobu_tol0002.plot(ax=axs[1, 0], color="red")
gdf_shigenobu.plot(ax=axs[1, 0], linewidth=0.8, linestyle=':')
axs[1, 0].set_title('tolerance=0.002')
gdf_shigenobu_tol002.plot(ax=axs[1, 1], color="red")
gdf_shigenobu.plot(ax=axs[1, 1], linewidth=0.8, linestyle=':')
axs[1,1].set_title('tolerance=0.02')
#グラフの間隔を調整する
plt.tight_layout()
#グラフを表示
plt.show()

直交座標系だとtoleranceの数値が小数オーダーでは全く変化がありません。
#gdf_shigenobuの座標系を経度緯度(EPSG:6668)から国土地理院直交座標系(EPSG:6672)
#国土数値情報からダウンロードした愛媛県の河川データ(shape形式)をGeoPandasで読み込み
gdf_stream = gpd.read_file('/content/drive/MyDrive/Colab Notebooks/W05-06_38_GML(EhimePrefRiverData)/W05-06_38-g_Stream.shp')
#gdf_shigenobuは座標系が定義されていなさそうなので、EPSG6668として定義
gdf_stream.crs = "EPSG:6668"
#gdf_shigenobuの座標系をEPSG:6672に変換
gdf_stream = gdf_stream.to_crs("EPSG:6672")
###tolerancなし
#重信川(水系コード=88081)のデータのみをプロット
#水系コード列W05_001の中から水系コード880801の行のみを抽出し、
#gdf_shigenobuを生成。
gdf_shigenobu = gdf_stream[gdf_stream['W05_001'] == '880801']
###tolerance=20000で計算
#重信川(水系コード=88081)のデータのみをプロット
#水系コード列W05_001の中から水系コード880801の行のみを抽出し、
#gdf_shigenobuを生成。
gdf_shigenobu_tol20000 = gdf_stream[gdf_stream['W05_001'] == '880801']
#許容値tolerance=2000に変更
gdf_shigenobu_tol20000['simplegeom'] = gdf_shigenobu_tol20000.simplify(tolerance=20_000)
gdf_shigenobu_tol20000 = gdf_shigenobu_tol20000.set_geometry('simplegeom')
###tolerance=2000で計算
#重信川(水系コード=88081)のデータのみをプロット
#水系コード列W05_001の中から水系コード880801の行のみを抽出し、
#gdf_shigenobuを生成。
gdf_shigenobu_tol2000 = gdf_stream[gdf_stream['W05_001'] == '880801']
#許容値tolerance=2000に変更
gdf_shigenobu_tol2000['simplegeom'] = gdf_shigenobu_tol2000.simplify(tolerance=2000)
gdf_shigenobu_tol2000 = gdf_shigenobu_tol2000.set_geometry('simplegeom')
###tolerance=200で計算
#重信川(水系コード=88081)のデータのみをプロット
#水系コード列W05_001の中から水系コード880801の行のみを抽出し、
#gdf_shigenobuを生成。
gdf_shigenobu_tol200 = gdf_stream[gdf_stream['W05_001'] == '880801']
#許容値tolerance=2000に変更
gdf_shigenobu_tol200['simplegeom'] = gdf_shigenobu_tol200.simplify(tolerance=200)
gdf_shigenobu_tol200 = gdf_shigenobu_tol200.set_geometry('simplegeom')
#グラフで結果を表示
fig, axs = plt.subplots(nrows=2, ncols=2, figsize=(8, 8))
gdf_shigenobu.plot(ax=axs[0, 0])
axs[0, 0].set_title('No tolerance')
gdf_shigenobu_tol200.plot(ax=axs[0, 1], color="red")
gdf_shigenobu.plot(ax=axs[0, 1], linewidth=1, linestyle=':')
axs[0, 1].set_title('tolerance=200')
gdf_shigenobu_tol2000.plot(ax=axs[1, 0], color="red")
gdf_shigenobu.plot(ax=axs[1, 0], linewidth=1, linestyle=':')
axs[1, 0].set_title('tolerance=2000')
gdf_shigenobu_tol20000.plot(ax=axs[1, 1], color="red")
gdf_shigenobu.plot(ax=axs[1, 1], linewidth=1, linestyle=':')
axs[1,1].set_title('tolerance=20000')
#グラフの間隔を調整する
plt.tight_layout()
#グラフを表示
plt.show()

逆に、直交座標系だとtoleranceが2000とか20000といったオーダーで単純化の成果が目に見えてきます。
座標系によってtoleranceのオーダーが異なるということが理解できました。
ちなみに、単純化したgeometryデータをオリジナルデータに戻せるのか、ChatGPT先生に聞いてみたら、こんな回答をいただきました。
simplifyでtolerance=20000で単純化したgeometryを元に戻す方法はありますか
simplify() 関数を使用してジオメトリを単純化した場合、元のジオメトリに戻すことはできません。これは、単純化がジオメトリの情報を減らしてしまうためです。
ただし、元のジオメトリを単純化する前に、元のジオメトリを別の変数に保存することができます。そして、単純化されたジオメトリをプロットするなどの目的で使用し、必要に応じて元のジオメトリを使用することができます。


コメント
コメントを投稿